10 years after the Satoshi Nakamoto whitepaper, the Bitcoin 10-year anniversary is coming up this Wednesday, October 31st, 2018.
Bitcoin is the most popular digital currency whose current market cap is over $138 billion. There are a number of Bitcoin exchange platforms where one can buy and sell the cryptocurrency. The services are also available on ATMs and banks.
Today, nations such as China which was initially a no-go area for cryptocurrencies are warming up to the idea of digital currencies. This happened after a local court allowed merchants to accept Bitcoin as a mode of payment. Such a landmark decision will bring unprecedented growth to the region and across the world in general.
There have been repeats of hackers stealing large amounts of Bitcoins; this is a major deterring factor to the entry of investors into the crypto industry. Theft places financial institutions at high risk of losing large sums of money. However, firms such as NXMH and Fidelity have shown confidence in the future of cryptocurrencies. They believe that this move will attract investors who’ll bring in a significant amount of profit.
Price Analysis…
Bitcoin, previously known for its volatility, has over the last couple of weeks traded in a constricted range. The price moves with a bearish angle under the $6,500 mark. It’s quite clear that Bitcoin could decline in the near future since it’s already struggling to maintain the $6,450 level.
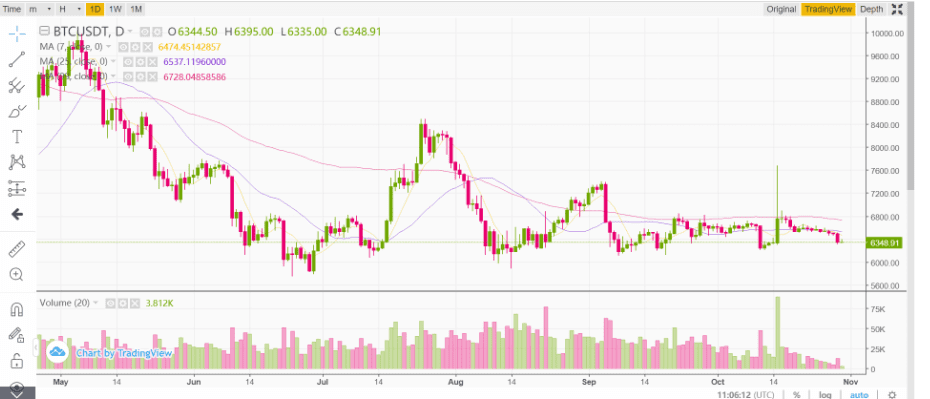
Experts feel that Bitcoin displays a conundrum of indirection; it neither gets to the peak nor hits a trough. Bitcoin has in some way lost momentum.
There is a risk of a downside break towards the $6,250 mark. For the buyers could push the price in a more positive zone by clearing the $6,500 and the $6,550 barriers. A break below $6,500 means that Bitcoin will sell for a much lower price.
Watching the movement of the Bitcoin prices gives us an idea about whether or not it’s headed in the right direction and we’re in a better position to make the right investment decision. However, one has to watch it for a couple more days before making a conclusive decision from the trend.
A technical analysis of DVAN long term trend lines indicates Bitcoin returning to its recent downward direction.
Its baseline indicator, which has been hovering above its algorithm line, will not portend an optimistic future.
So long as the baseline remains over the algorithm line, Bitcoin could keep on its decline. But if the algorithm line cross over the baseline, investors might look at it being a buy signal as well as the cryptocurrency could observe a recovery.
Before that occurs, Bitcoin might retest the $6,000 level. A digital currency, presently hovering around $6,200, last crossed $6,000 in mid-August and hasn’t closed under that price since June. The cost of Bitcoin has stepped a lot more than 66 percent because it hit an archive high of $19,511 in mid-December.
The cryptocurrency space continues to be riven by several issues this season, including bigger regulatory scrutiny along with a slow adaption of digital tokens as payment systems.
The entire market capitalization of virtual currencies has dropped significantly this season. Digital tokens have erased a lot more than $600 billion in market price since January.